
Page 44 - Annual Report 2021 EN
P. 44
/ 44 T ABLE OF C ONTENT S
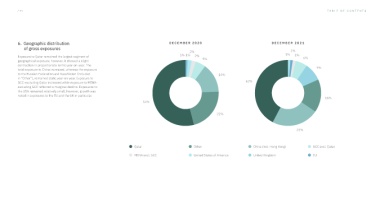
6. Geographic distribution DECEMBER 2020 DECEMBER 2021
of gross exposures
Exposure to Qatar remained the largest segment of
geographical exposure, however, it showed a slight
contraction in proportionate terms year-on-year. The
total exposure to China increased, whereas the exposure
to the Russian Federation and Kazahkstan (included
in “Other”), remained static year-on-year. Exposure to
GCC-excluding Qatar increased while exposure to MENA-
excluding GCC reflected a marginal decline. Exposures to
the USA remained relatively small, however, growth was
noted in exposures to the EU and the UK in particular.
Qatar Other China (incl. Hong Kong) GCC excl. Qatar
MENA excl. GCC United States of America United Kingdom EU