
Page 51 - Annual Report 2020
P. 51
/ 46 QF CR A ANNU AL REP OR T 2020
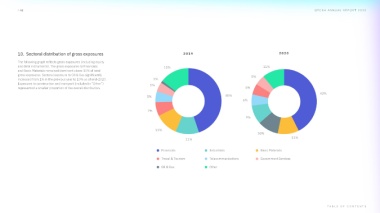
10. Sectoral distribution of gross exposures
The following graph reflects gross exposures (including equity
and debt instruments). The gross exposures to Financials
and Basic Materials remained dominant above 10% of total
gross exposures. Sectoral exposure to Oil & Gas significantly
increased from 1% in the previous year to 10% as of end-2020.
Exposures to construction and transport (included in “Other”)
represented a smaller proportion of the overall distribution.
T ABLE OF C ONTENT S