
Page 51 - Annual Report 2019
P. 51
48 ANNUAL REPORT 2019 SUPERVISION AND AUTHORISATION
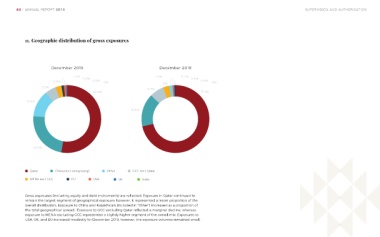
11. Geographic distribution of gross exposures
December 2019 December 2018
1.2% 0.9% 1.5% 0.7% 0.4%
2.8% 0.6% 0% 3% 0.4% 0%
5.3% 6.7%
52.8% 71.5%
12.8%
15.8%
23.5%
Qatar China (incl. Hong Kong) Other GCC excl. Qatar
MENA excl. GCC EU USA UK India
Gross exposures (including equity and debt instruments) are reflected. Exposure in Qatar continued to
remain the largest segment of geographical exposure; however, it represented a lesser proportion of the
overall distribution. Exposure to China and Kazakhstan (included in “Other”) increased as a proportion of
the total geographical spread. Exposure to GCC-excluding Qatar reflected a marginal decline, whereas
exposure to MENA-excluding GCC represented a slightly higher segment of the overall mix. Exposures to
USA, UK, and EU increased modestly for December 2019, however, the exposure volumes remained small.