
Page 64 - Annual Report 2020
P. 64
/ 59 QF CR A ANNU AL REP OR T 2020
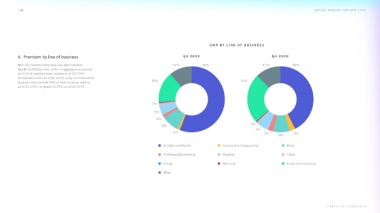
G WP B Y LINE OF BUSINES S
4. Premium by line of business
Non-life insurance business was dominated by 11% 56% 12% 43%
Health and Motor lines, which in aggregate accounted
for 51% of total business volume as of Q4 2020
compared to 64% as of Q4 2019. Long-term insurance
15% 24%
business represented 24% of total business volume
as of Q4 2020 compared to 15% as of Q4 2019.
0%
5%
2%
0%
8%
6%
1%
3% 3%
8%
T ABLE OF C ONTENT S