
Page 65 - Annual Report 2017
P. 65
| 64 65 |
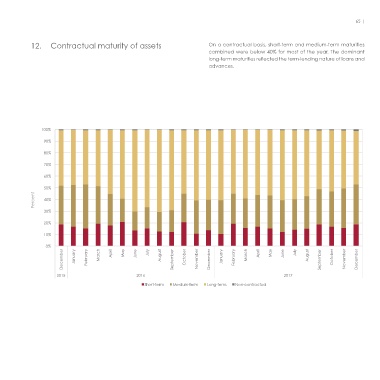
11. Geographic distribution of Gross exposures (including equity and debt instruments) are 12. Contractual maturity of assets On a contractual basis, short-term and medium-term maturities
gross exposures reflected. Exposures in Qatar continued to dominate and grew, combined were below 40% for most of the year. The dominant
but this growth was eclipsed by the increase in exposures to China, long-term maturities reflected the term-lending nature of loans and
which rose QAR 3.1 billion. The largest decreases were in expo- advances.
sures to the GCC excluding Qatar, India and Other (the largest
drop being seen in exposures to South Africa). “Other” geographies
comprised 10 countries in 2017 as compared to 11 in 2016.
100%
90%
2017 DECEMBER 2016 DECEMBER
80%
30.2% CHINA 22.0% CHINA
(INCL. HONG KONG) (INCL. HONG KONG) 70%
1.4% EU 1.2% EU
60%
5.7% GCC 10.5% GCC
(EXCL. QATAR) (EXCL. QATAR) 50%
Percent 40%
1.7% INDIA 3.1% INDIA
1.5% MENA 1.9% MENA
(EXCL. GCC) (EXCL. GCC) 30%
5.1% OTHER 5.1% OTHER 20%
56.1% QATAR 54.6% QATAR
10%
1.0% UK 0.7% UK
0%
December January February August September October November December January February August September October November December
0.9% USA 0.9% USA March April May June July March April May June July
2015 2016 2017
Short-term Medium term Long term Non-contractual