Page 62 - Annual Report 2017
P. 62

| 62                                                                                                                                                                                                                                                                   63 |


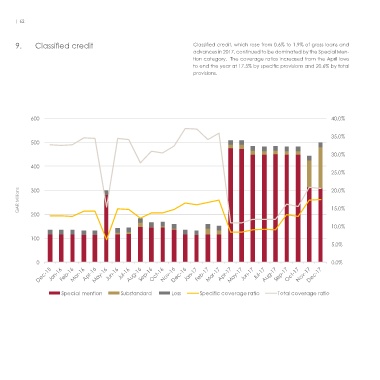
       9.     Classified credit                                         Classified credit, which rose from 0.6% to 1.9% of gross loans and             10.  Sectoral distribution of                                    Gross  exposures  (including  equity  and  debt  instruments)  are
                                                                        advances in 2017, continued to be dominated by the Special Men-                       gross exposures                                           reflected. The most significant changes year-on-year were the
                                                                        tion category.  The coverage ratios increased from the April lows                                                                               increased exposure to Industrials offset by decreases in Financials,
                                                                        to end the year at 17.5% by specific provisions and 20.6% by total                                                                              Construction and Real Estate (included in “Other”). Financials
                                                                        provisions.                                                                                                                                     remained the largest exposure, while Construction and Industrials
                                                                                                                                                                                                                        were the only other sectors that exceeded 10%.


            600                                                                                                           40.0%


                                                                                                                          35.0%
            500
                                                                                                                                                       2017 - DECEMBER                                                  2016 - DECEMBER
                                                                                                                          30.0%
                                                                                                                                                          35.6% FINANCIALS                                                 38.1% FINANCIALS
            400
                                                                                                                          25.0%                           18.2% INDUSTRIALS                                                9.0% INDUSTRIALS
                                                                                                                                                          10.7% CONSTRUCTION                                               14.8% CONSTRUCTION
                                                                                                                                                          7,7% TRANSPORT,
                                                                                                                                                                                                                           8.5% TRANSPORT,
        QAR Millions  300                                                                                                 20.0%                           STORAGE AND LOGISTICS                                            STORAGE AND LOGISTICS
                                                                                                                                                                                                                           5.4% BUSINESS SERVICES
                                                                                                                                                          5.5% BUSINESS SERVICES
            200                                                                                                           15.0%                           5.5% OIL & GAS                                                   5.9% OIL & GAS
                                                                                                                                                          5.2% CONSUMER GOODS                                              5.1% CONSUMER GOODS
                                                                                                                          10.0%
                                                                                                                                                          11.6% OTHER                                                      13.1% OTHER
            100
                                                                                                                          5.0%


              0                                                                                                           0.0%


                       Special mention       Substandard        Loss      Specific coverage ratio     Total coverage ratio
   57   58   59   60   61   62   63   64   65   66   67