Page 58 - Annual Report 2017
P. 58

| 58                                                                                                                                                                                                                                                                   59 |


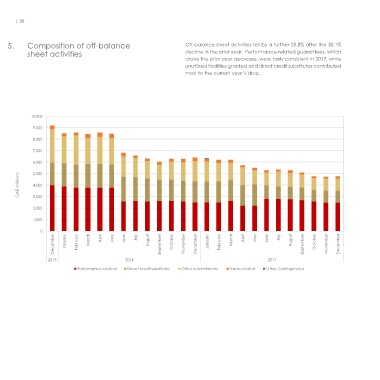
    5.     Composition of off-balance                                Off-balance sheet activities fell by a further 25.8% after the 30.1%              6.     Composition of the income                                 Overall profitability was lower than in 2016, primarily due to higher
           sheet activities                                          decline in the prior year.  Performance-related guarantees, which                        statement                                                 credit losses, which amounted to 18.0% of net interest income as
                                                                     drove the prior year decrease, were fairly consistent in 2017, while                                                                               compared to 1.6% in 2016.  Some volatility was seen in the income
                                                                     unutilised facilities granted and direct credit substitutes contributed                                                                            statement as a result of fair value gains/(losses) on financial instru-
                                                                     most to the current year’s drop.                                                                                                                   ments, included in non-interest revenue.


            10,000                                                                                                                                       60,000
             9,000
                                                                                                                                                         40,000
             8,000

             7,000
                                                                                                                                                         20,000
             6,000

             5,000
        QAR Millions  4,000                                                                                                                           QAR Thousands  -20,000 0  January  February  March  April  May  June  July  August  September  October  November  December  January  February  March  April  May  June  July  August  September  October  November  December


             3,000
                                                                                                                                                                                          2016                                                     2017
             2,000
                                                                                                                                                        -40,000
             1,000
                0                                                                                                                                       -60,000
                     December  January  February  March  April  May  June  July  August  September  October  November  December  January  February  March  April  May  June  July  August  September  October  November  December  -80,000


                   2015                        2016                                                2017                                                                  Net interest income                   Non-interest revenue                  Credit losses
                             Performance-related  Direct credit substitutes  Other commitments  Trade-related  Other Contingencies                                       Operating expenses                    Non-trading and capital items         Associates and  JVs
                                                                                                                                                                         Taxation                              Operating profit /(loss)              Profit/(loss)
   53   54   55   56   57   58   59   60   61   62   63