
Page 61 - Annual Report 2017
P. 61
| 60 61 |
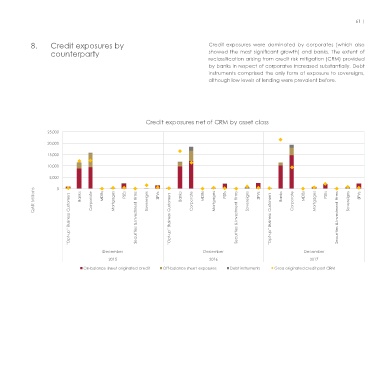
7. Net interest margin Net interest margin (NIM) remained under pressure, trending down 8. Credit exposures by Credit exposures were dominated by corporates (which also
over the year to 0.9%. The contraction resulted from slightly better counterparty showed the most significant growth) and banks. The extent of
yields being outweighed by the higher cost of funds. reclassification arising from credit risk mitigation (CRM) provided
by banks in respect of corporates increased substantially. Debt
instruments comprised the only form of exposure to sovereigns,
although low levels of lending were prevalent before.
4.0 % Credit exposures net of CRM by asset class
25,000
3.5 %
20,000
3.0 %
15,000
2.5 % 10,000
2.0 % 5,000 0
Percent 1.5 % QAR Millions Banks Corporate MDBs Mortgages PSEs Sovereigns SPVs Banks Corporate MDBs Mortgages PSEs Sovereigns SPVs Banks Corporate MDBs Mortgages PSEs Sovereigns SPVs
1.0 %
0.5 % ''Opt-up'' Business Customers Securities & Investment Firms ''Opt-up'' Business Customers Securities & Investment Firms ''Opt-up'' Business Customers Securities & Investment Firms
0.0 %
January February March April May June July August September October November December January February March April May June July August September October November December December December December
2017
2015
2016
2016 2017 On-balance sheet originated credit Off-balance sheet exposures Debt instruments Gross originated credit post CRM
NII% NIM Interest yield Interest cost