
Page 41 - Annual Report 2019
P. 41
38 ANNUAL REPORT 2019 SUPERVISION AND AUTHORISATION
Charts: Banks and Investment Firms
The selection of charts illustrates some of the categories of data collected by
the Regulatory Authority as part of discharging its supervisory responsibilities.
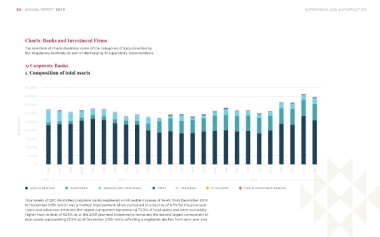
A) Corporate Banks
1. Composition of total assets
QAR Millions
DEC JAN FEB MAR APR MAY JUN JUL AUG SEP OCT NOV DEC JAN FEB MAR APR MAY JUN JUL AUG SEP OCT NOV DEC
2017 2018 2019
Loans & advances Investments Balances with other banks Other Derivatives ST securities Cash & central bank balances
Total assets of QFC-domiciled corporate banks registered a noticeable increase of 34.4% from December 2018
to December 2019, which was a marked improvement when compared to a decline of 8.7% for the prior year.
Loans and advances remained the largest component representing 73.9% of total assets and were noticeably
higher than its level of 62.6% as at the 2018 year-end. Investments remained the second largest component of
total assets representing 23.9% as at December 2019, while reflecting a negligible decline from prior year-end.